In my last blog https://datasciencing.com/f/lets-have-data-fun-with-excel-find-and-replace I talked about the “Find” function in Excel. It lets you find any text on your Excel worksheet. The “Replace” function, as the name implies, lets you replace any text on your worksheet, with different text. This is very helpful when looking for errors in your worksheet, like spelling mistakes or extra spaces.
To access this function you an use the shortcut Ctrl+H or on the menu select Home->”Find & Select”.

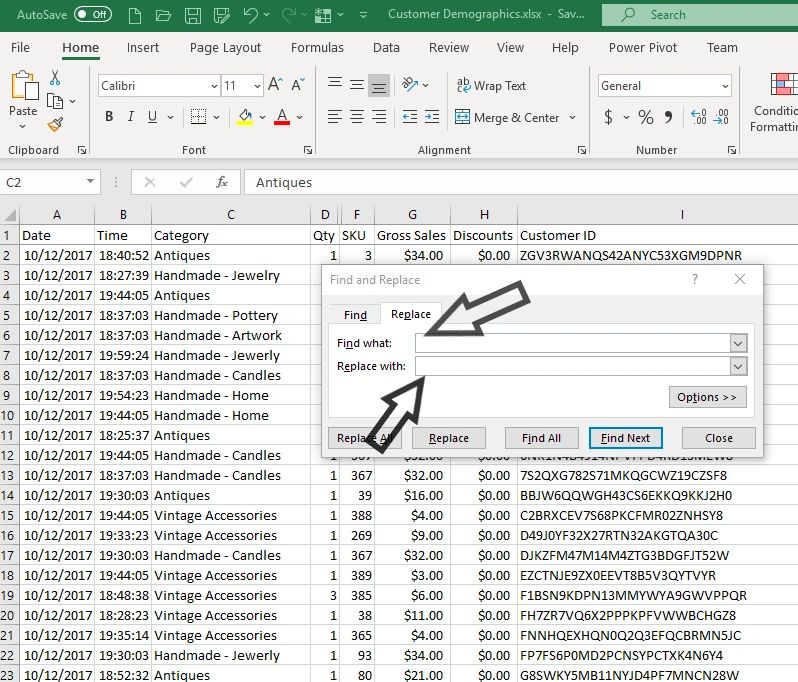
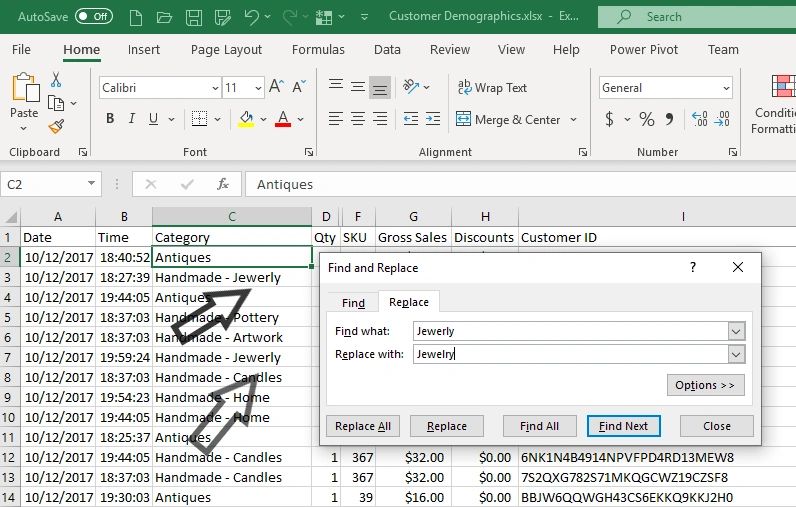
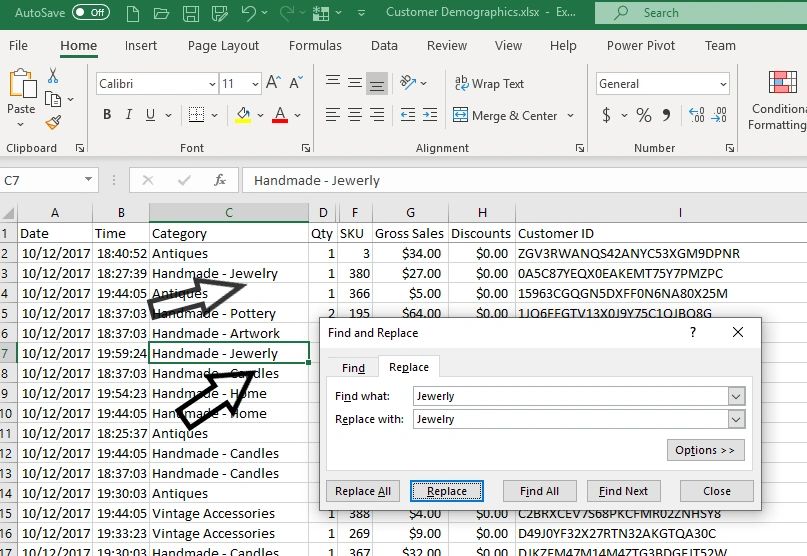
A pop-up window will pop up. Click on “Replace”. In the “Find what:” text box enter the text you want to find and in the “Replace with:” text box enter the text you want to be replaced with.
Here you can use the “Find All” and “Find” functions as described in part 1. You can also the “Replace All” and “Replace” functions.
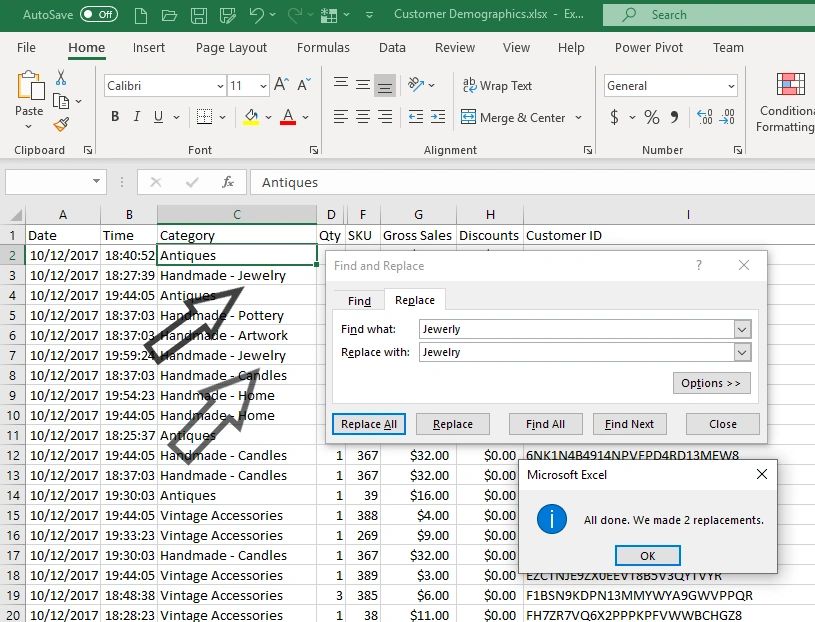
Clicking “Replace All” replaces the text in every cell on your worksheet.
Clicking “Replace” only replaces the text in the cell you’ve selected. However Excel will then select the next cell that contains the text you’re looking for.
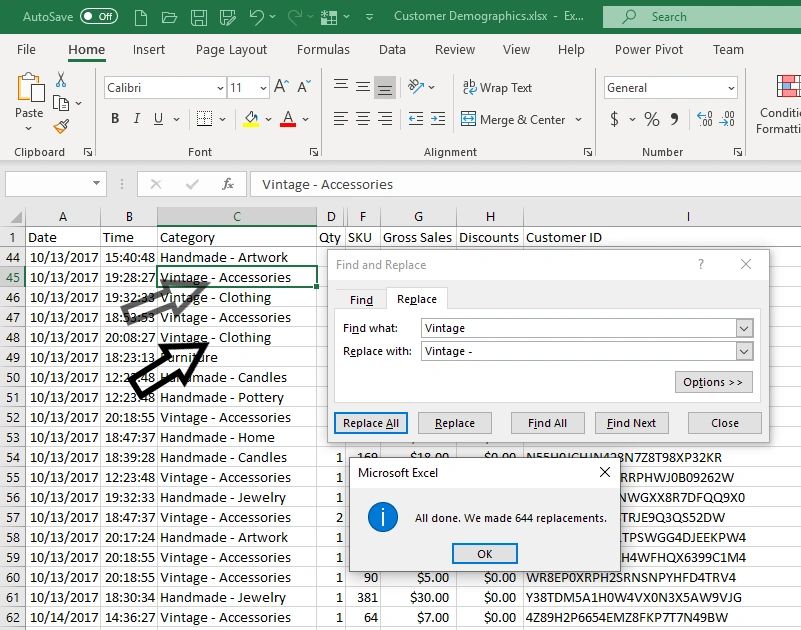
Another benefit to the “Replace” function is making formatting changes on your worksheet. In this sample data items sold are categorized into categories such as: Handmade – Candles, Handmade – Pottery, Vintage Clothing, and Vintage Accessories. To be consistent we want to change all the categories that start with Vintage to also have a – (dash).
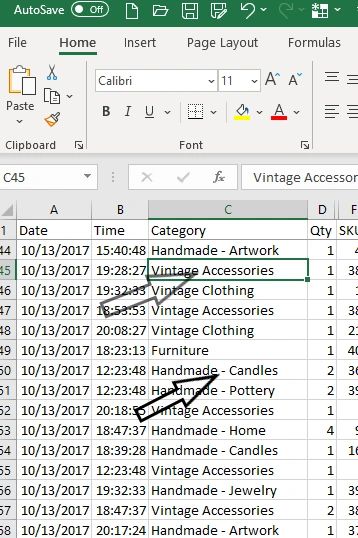
In the “Find what:” field we enter “Vintage” and the “Replace with:” field we enter “Vintage -“. Click “Replace All” and voila all the categories that start with Vintage, now have a – (dash). To be consistent with the “Handmade – ” categories.