Be the Master of Your Business Data
We help leaders make business decisions with more confidence, using the data that’s already at your fingertips.
How we help
Making complex data simple to use.
Data Cleaning
Is your business’ data a mess? We’ll roll up our sleeves and help you clean it up, improving its integrity and your ability to rely on it.
Data Aggregation
Is your data trapped in separate systems that don’t talk to each other? Are your CRM and Financial Managment data segregated? We can help bring these worlds together!
Visual Analytics
Are the “built in” data visualizations you use falling short? We can develop custom, interactive dashboards that help you see things in a whole new light.
KPIs and Metrics
Are you stuck looking at the numbers your software publisher says are important? We’ll help understand the perfromance indicators and metrics that are important to your unique business – then help you find a way to easily keep an eye on them.
Data Analysis
Struggling to analyze and tell stories with your data? Having difficulty making business decisions driven by data? We can help you analyze your data, weave it into narrative, and make it accessible for the purpose of decision making.
Software Support
Struggling with that Excel pivot table? Difficulty getting that chart to appear the way you want it? Can’t quite slice your data the way you need? We’ve got skills in a wide variety of tools and we’re here to help.
We’re making a difference
We’ve helped a lot of businesses master their data and experience the world of cutting-edge data analysis. Could your business be next?
Data SCIENCING Blog
Let’s have fun with data!
Using R to analyze Worlds Trends of Life Expectancy and Birth Rate
https://www.youtube.com/watch?v=KhNXxqNUzW8&t=20s&ab_channel=datasciencing Join our founder Peter Koebel as he demonstrates Using R to analyze Worlds Trends of Life Expectancy and Birth Rate. Population and world trend data is some of the most fun to analyze...
US Population Density Map using Tableau
https://www.youtube.com/watch?v=tZcrQsT8HMM&ab_channel=datasciencing Join our founder, Peter Koebel as he demonstrates a population density map using Tableau. You've probably seen population density visualizations everywhere, but how can you use them in your own...
Datasciencing Customer Demographics with Power BI
https://www.youtube.com/watch?v=t7GkRwIRqQI&t=152s&ab_channel=datasciencing Join our founder, Peter Koebel, as he walks through datasciencing customer demographics with Power BI. Datasciencing can be tough, but does it have to be? Check out this demonstration...
Predicting Profits of Start Ups using Machine Learning and Python
https://www.youtube.com/watch?v=r5FfWKvCG8k&t=752s&ab_channel=datasciencing Join our founder Peter Koebel as he walks through Jupyter using machine learning and Python. Using machine learning and Python in a tool like Jupyter can be extremely powerful when...
Measuring Customer Satisfaction With Likert Scales in Tableau
https://www.youtube.com/watch?v=AYmQVbASpzM&ab_channel=datasciencing Join our founder Peter Koebel as he walks you through a demo of using likert scales in Tableau. Likert Scales in Tableau can be an extremely powerful tool for measuring and analyzing customer...
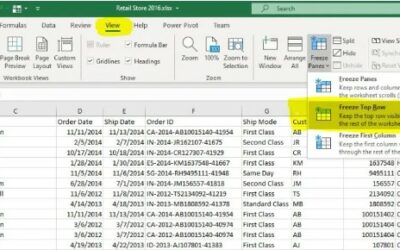
10 Awesome Excel Tips: Freeze Panes Will Help You Focus!
Imagine you’re working in your Excel spreadsheet and you scroll down the rows and notice your column names are missing. Freeze Panes is what you're looking for! One way to prevent this from happening is to go into the menus and under ‘View’ select ‘Freeze Top Row’....
From Our Clients
We love our clients – and apparently they love us too!
“Peter helped me create some dashboards for my business. His work was of the highest quality and his communication was great.If you need an excel wizard or data scientists Peter is a great asset.”
“Today’s business world is driven by data and insights, and companies like Data Sciencing Consultants are just what the businesses these days need. They specialize in providing with superior business intelligence and data analysis that helps businesses make effective and efficient decisions. Through my interaction with Data Sciencing Consultants at Winnipeg Chamber of Commerce, I have found them to be very professional and helpful towards other businesses. Peter Koebel at Data Sciencing Consultants is very knowledgeable and expert in this area and a strong advocate of business community. I would highly recommend them!”
“Peter Koebel supported the team at Strategic Event Initiatives Inc. in its data science analysis for a major international project. Peter was very professional and provided timely reports based on the raw data provided.”
“I run an eCommerce agency and we had a project for a client that was bottlenecked by manipulating data in Excel. I quickly exhausted my own knowledge of Excel and tried various articles + how to videos spending a full day attempting to understand why my sheets were broken. I reached out to Peter and he solved my problem in half an hour. Our client project got completed and billed later that day.
I should have reached out to Peter at DSC right away! Would highly recommend his services to anyone looking for a data science expert!”
Let's Start Something new
Say Hello!
Complete the form below and we'll be in touch.