In today’s blog we’re going to further explore the “Replace” function in Excel. Focusing on the “Options” features. Click the links if you want to check out part 1 https://datasciencing.com/f/lets-have-data-fun-with-excel-find-and-replace, part 2 https://datasciencing.com/f/lets-have-data-fun-with-excel-find-and-replace-part-2 and part 3 https://datasciencing.com/f/lets-have-data-fun-with-excel-find-and-replace-part-3 of this series.
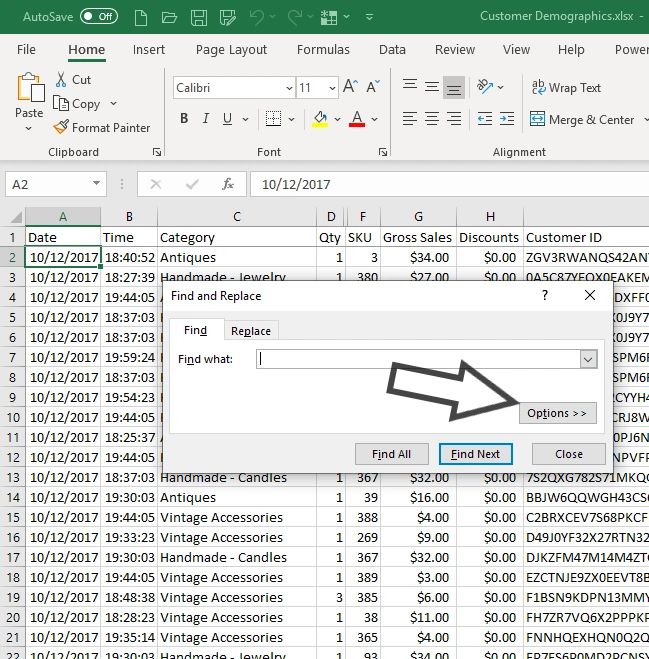
To access the “Options” features, open the “Find and Replace” window (click Ctrl+F or on the menu select Home->”Find & Select”). Then click on the “Options >>” button.
This will display a wide variety of options. Click on the “Replace” function. Today we’re going to explore the “Match case” option.
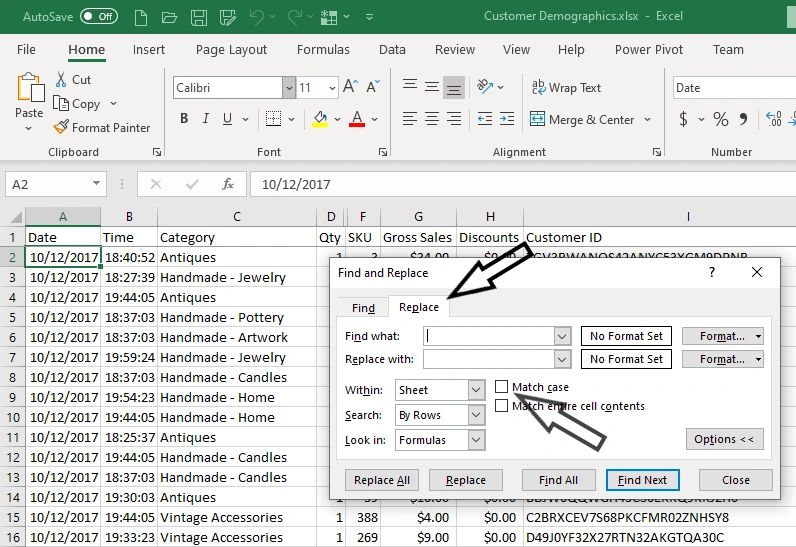
As we saw in part 3 of this series, the “Match case” option allows you to find text that is case sensitive to what you enter into the “Find what” field. Naturally it also allows you to replace text that is case sensitive to what you enter into the “Replace with” field.
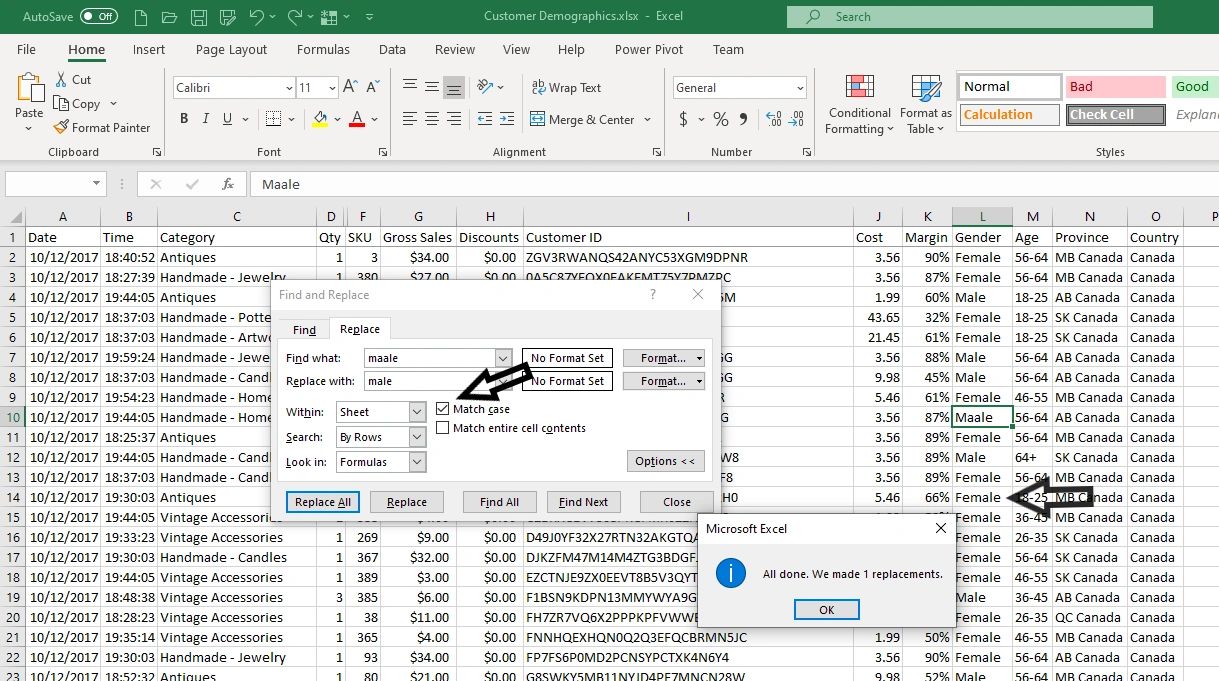
If you need to replace the misspelling of word that should capitalized in some instances and not capitalized in others, using the “Replace” function, will cause further problems.


In the example above, replacing ‘maale’ with ‘male’ and not using the “Match case” option, the instance where Male should be capitalized it was replaced with a non-capitalized text. To avoid this, use the “match case” option, for both “maale” and “Maale”.

In my experience, having to use the “Match case” option with “Replace All” doesn’t come up that often. However, your situation might need it more. Either way it’s a very good tool to have, as it will save a lot of time and give you more confidence in the data integrity of your data.