What is your company doing to avoid the survivorship bias trap?
I’ll give you a classic example of survivorship bias.
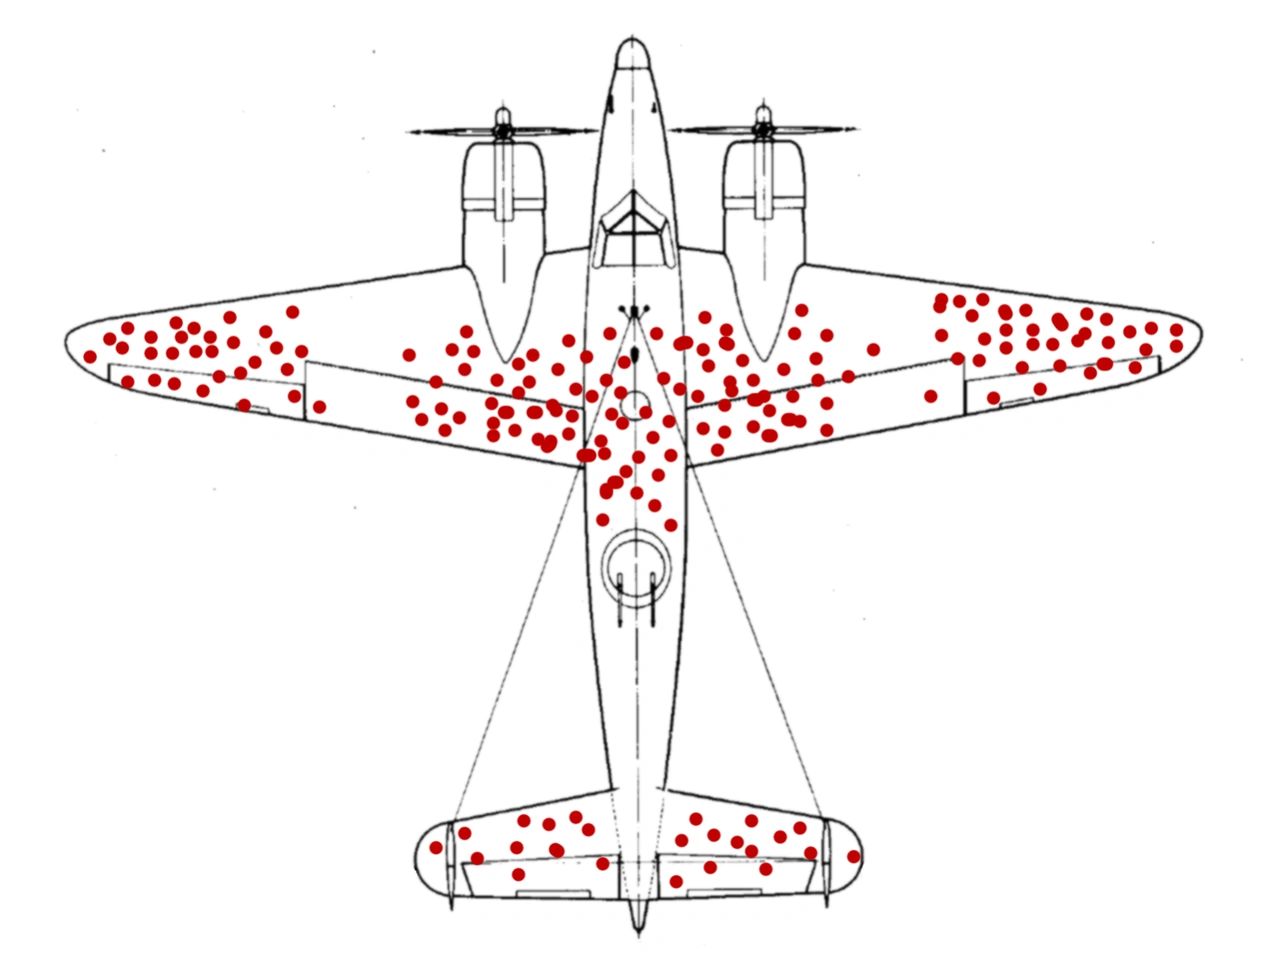
You might recognize this picture if you’ve studied survivorship bias, statistics, or data visualization.
In World War 2 the U.S. Military wanted to protect their planes, by increasing armour in certain vital areas.
They went to the scrap heap and collected a bunch of planes. They marked where the damage was. Each of these red dots represent bullet holes. The military was thinking they wanted to add armour to where they found all the bullet holes to protect the planes.
Until statistician Abraham Wald came in and took a look at this picture. Then suggested they add armour in the spots where there were no holes. Because he was looking at the big picture. And realized that all the planes that got shot in those spots, didn’t make it home.
With that analysis, the U.S. military realized the important elements of a functioning airplane are the engine and the pilot.
How can survivorship bias relate to your business?
Let’s pretend you’re performing an annual review of your projects. You look at your most successful projects to replicate their success. In doing so, you notice some common elements. Like smaller, more frequent shipments going out. Or increased manufacturing production.
Don’t forget to look at your less successful and failed projects. They may have used those strategies as well. Meaning those strategies are not a vital indicator of a successful project.
You’ll need to look at the big picture to properly identify what made a project successful.
Check out some more blog posts from Data Sciencing Consultants about strategy and biases!