by Peter Koebel | Oct 2, 2022 | Business Intelligence Tips, Data Visualization Tips
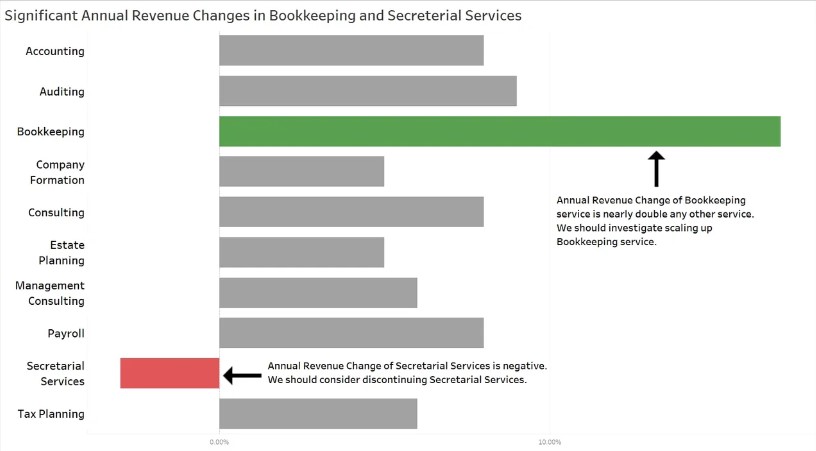
How can we adjust our data visualizations to improve meetings? Let’s pretend you’re in a meeting, reviewing your business services and the presenter shows you a standard chart like this one. Everyone will spend a lot of energy, trying to figure out what’s going on...

by Peter Koebel | Jul 28, 2022 | Business Intelligence Tips, Data Visualization Tips, Logic / Probability Tips
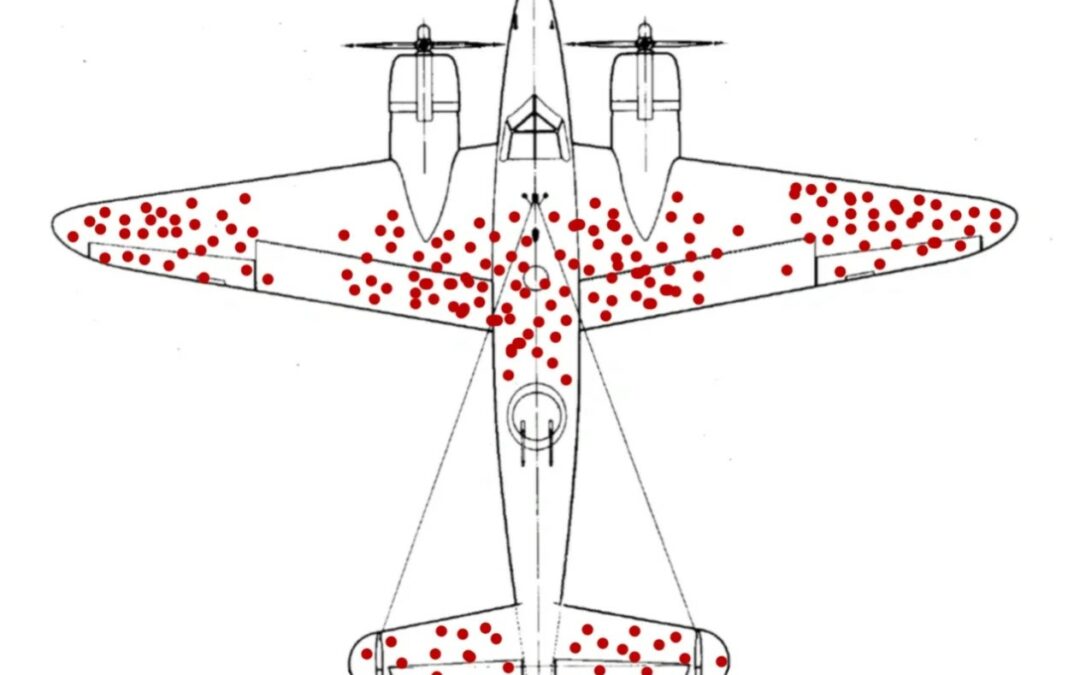
What is your company doing to avoid the survivorship bias trap? I’ll give you a classic example of survivorship bias. You might recognize this picture if you’ve studied survivorship bias, statistics, or data visualization. In World War 2 the U.S. Military wanted to...


