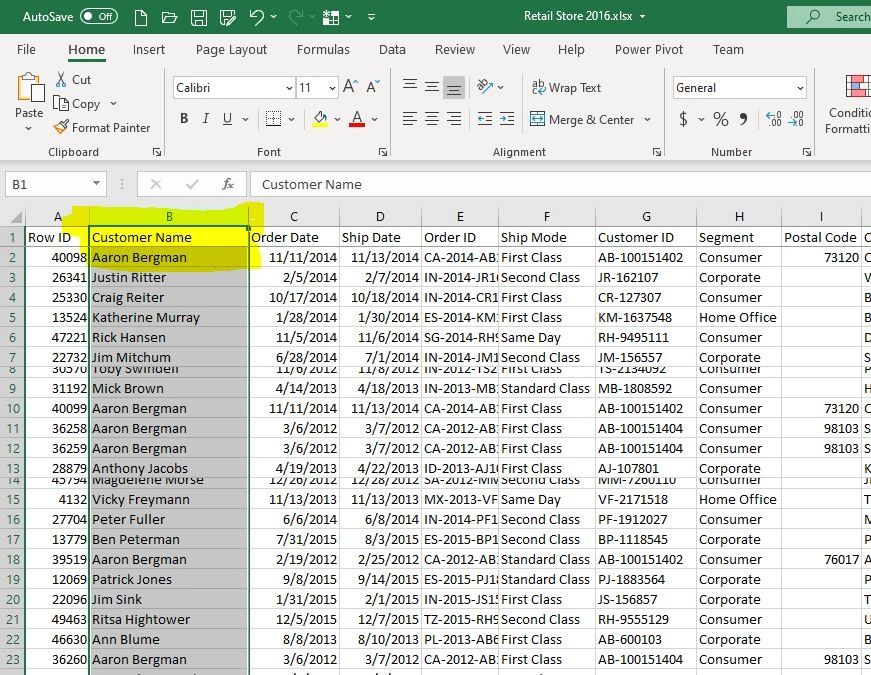
Has you ever opened an Excel file and noticed the column names are cut off and you can’t see all the information you want to look at? Adjusting column and row width is what you need!

One thing you can do, to widen the column width is select the column. Then go on the menu, under ‘Cells’, click ‘Format’ and click ‘AutoFit Column Width’. Adjusting column and row width is a breeze if you understand these simple tricks.

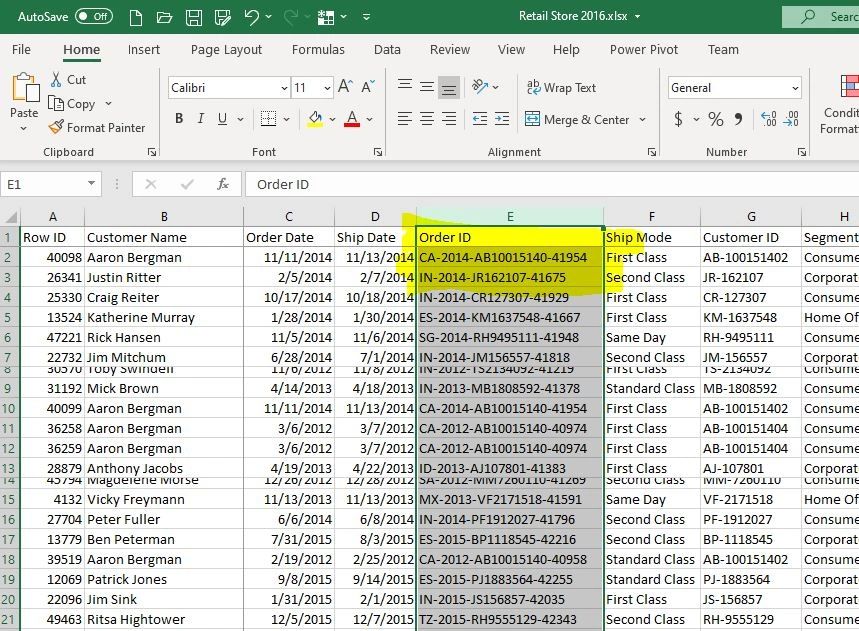
That will widen the column to the largest or longest name in your column.
A faster way of doing that is, selecting your column that you need to widen and double left-click at the end of the column, in between the columns.
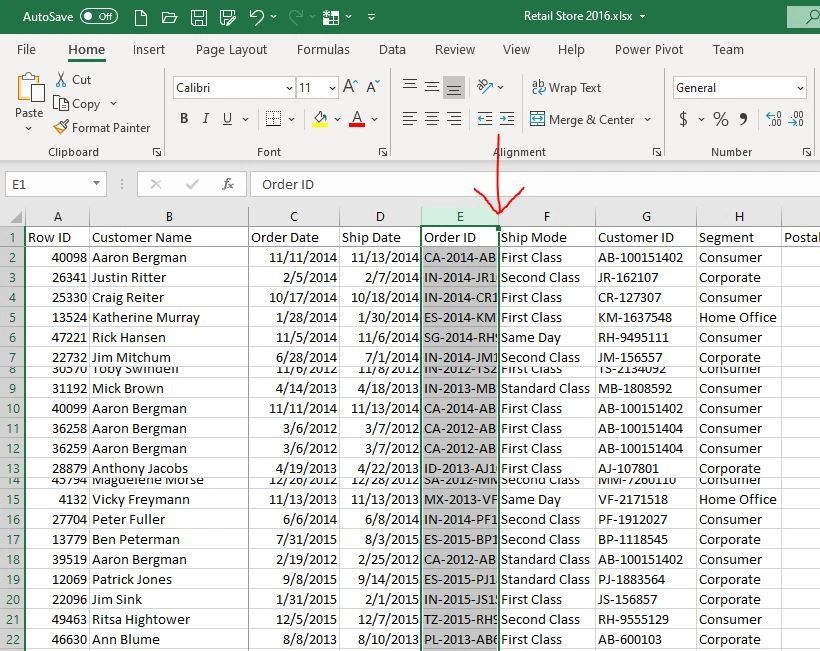
It will also automatically widen the column to the widest field.
As you might suspect, you can also do that with the row height.
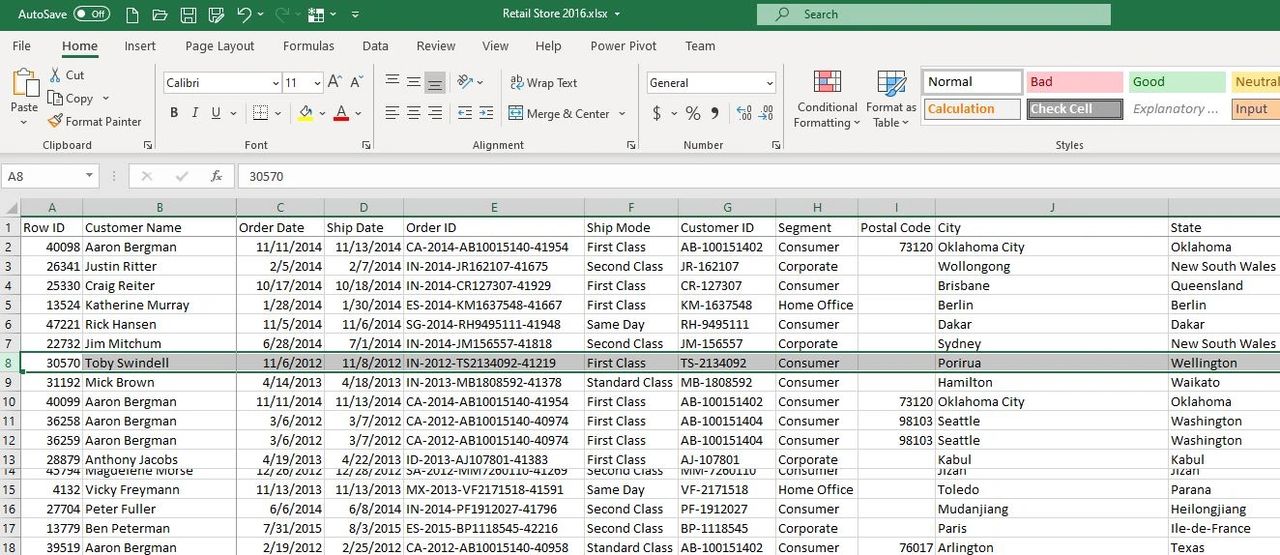
We can’t quite see what’s going on in row 8.

We select the row, go to ‘Format’, ‘AutoFit Row Height’.
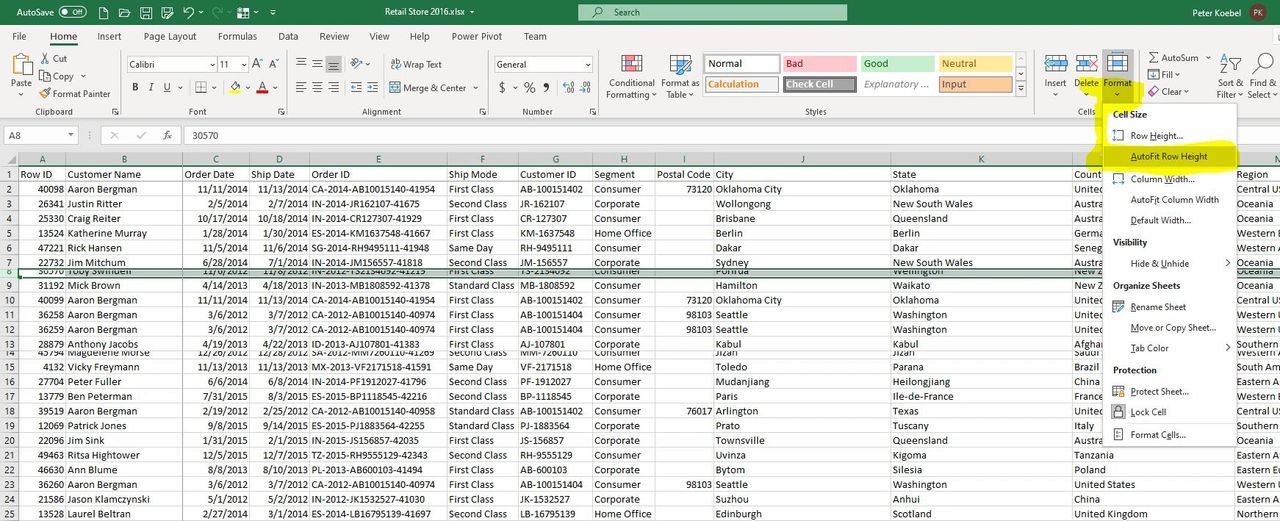
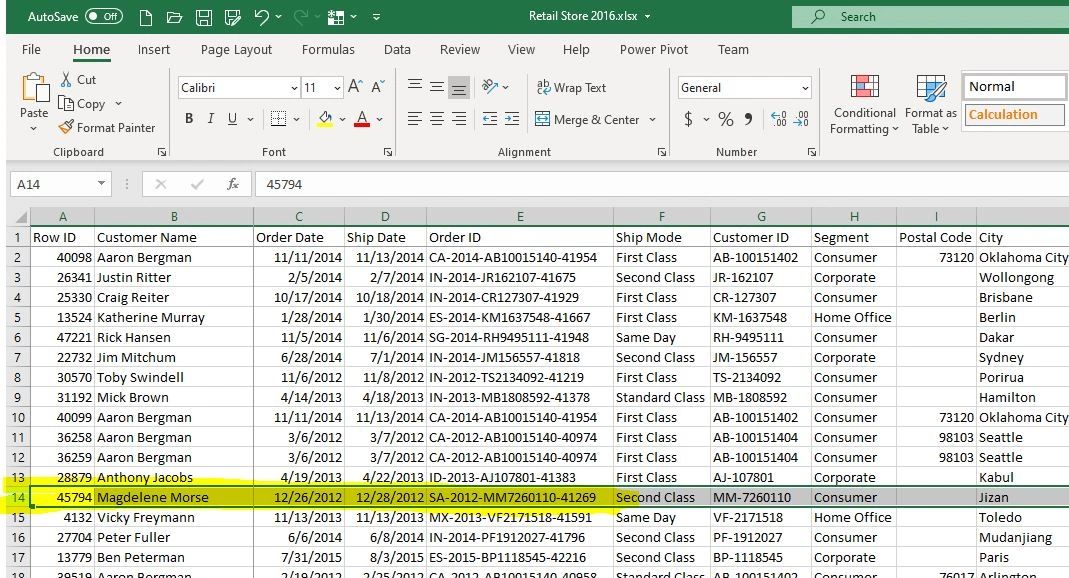
Now we can see the info in row 8.
You can also use the double click method. Just find the row that you need to make larger.
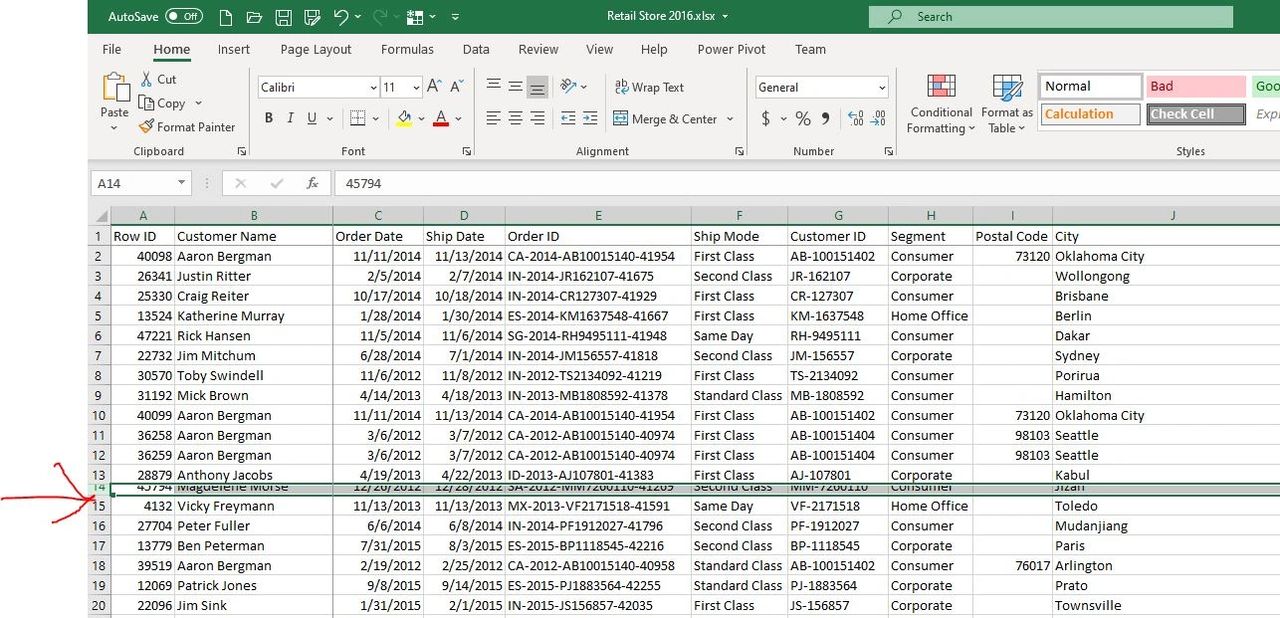
You double click underneath the row. And it will grow the maximum size of the cells in that row.
I’m Peter Koebel the owner of Data Sciencing Consultants. If you need assistance with your Excel spreadsheets, you can contact us at 204-770-6437, peter.koebel@datasciencing.com, or visit our website https://datasciencing.com.
You can also view my companion video for this Excel tip here: https://www.youtube.com/watch?v=U1Ck79hW1TY