How can we adjust our data visualizations to improve meetings? Let’s pretend you’re in a meeting, reviewing your business services and the presenter shows you a standard chart like this one.

Everyone will spend a lot of energy, trying to figure out what’s going on here. Also, they will spend a lot of time trying to come to an agreement. Creating much confusion and stalling the meeting.
Imagine the presenter had shown a chart, using the exact same data set, but applied new sophisticated strategies and techniques like the chart below.
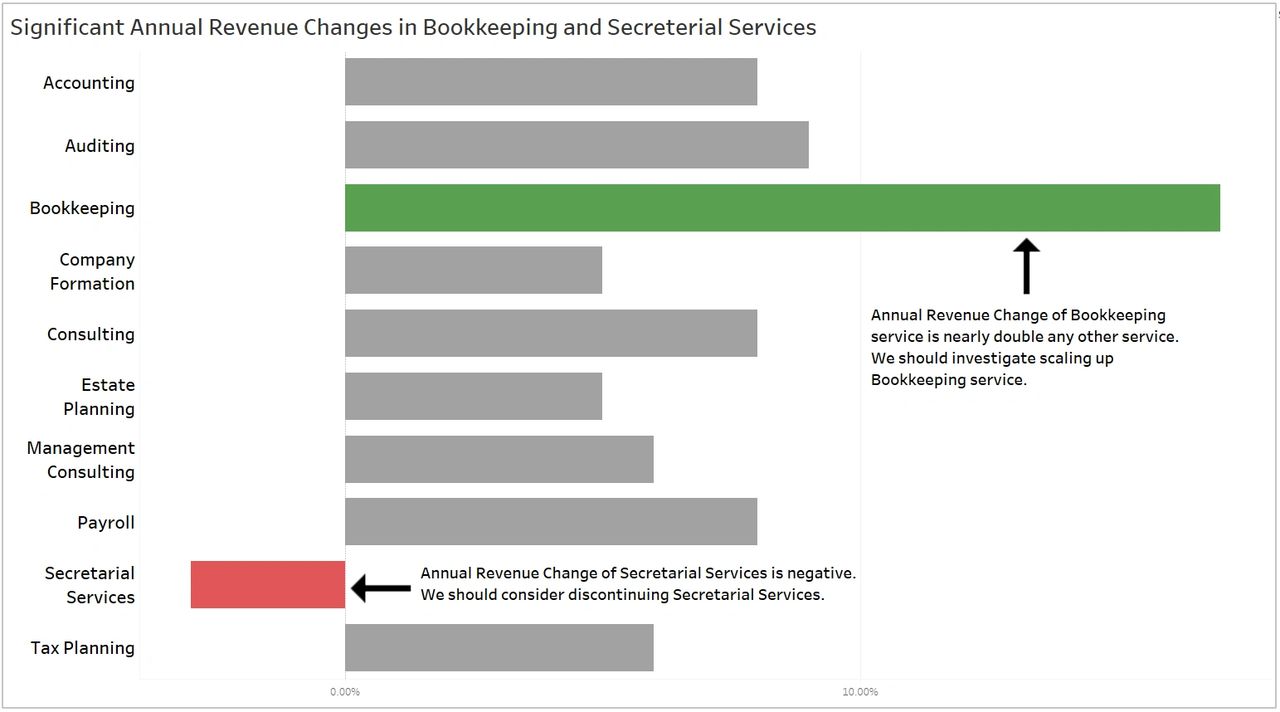
This chart has context and the data story right in the title. Along with notes, that have focused actionable insights. Everyone will be on the same page which will help improve meetings. Now you can briefly discuss who should be on the teams to investigate these next steps.
This will save you time, so you won’t be rushing at the end of the meeting. Plus, the meeting is unlikely to go overtime.
Another bonus, to using new strategies and techniques, is that this chart will save you a lot of mental energy. Which will prevent everyone from be exhausted at the end of the meeting.
If you want to improve your company’s meetings and presentations, contact me at 204-770-6437 or peter.koebel@datasciencing.com.
You can also check out our YouTube channel for more awesome Excel tips!
For more Awesome Excel Tips, like this one about “select all cells in a direction”, check out the Datasciencing Consultants blog.